Moisture Updates - July 26, 2023
Synopsis
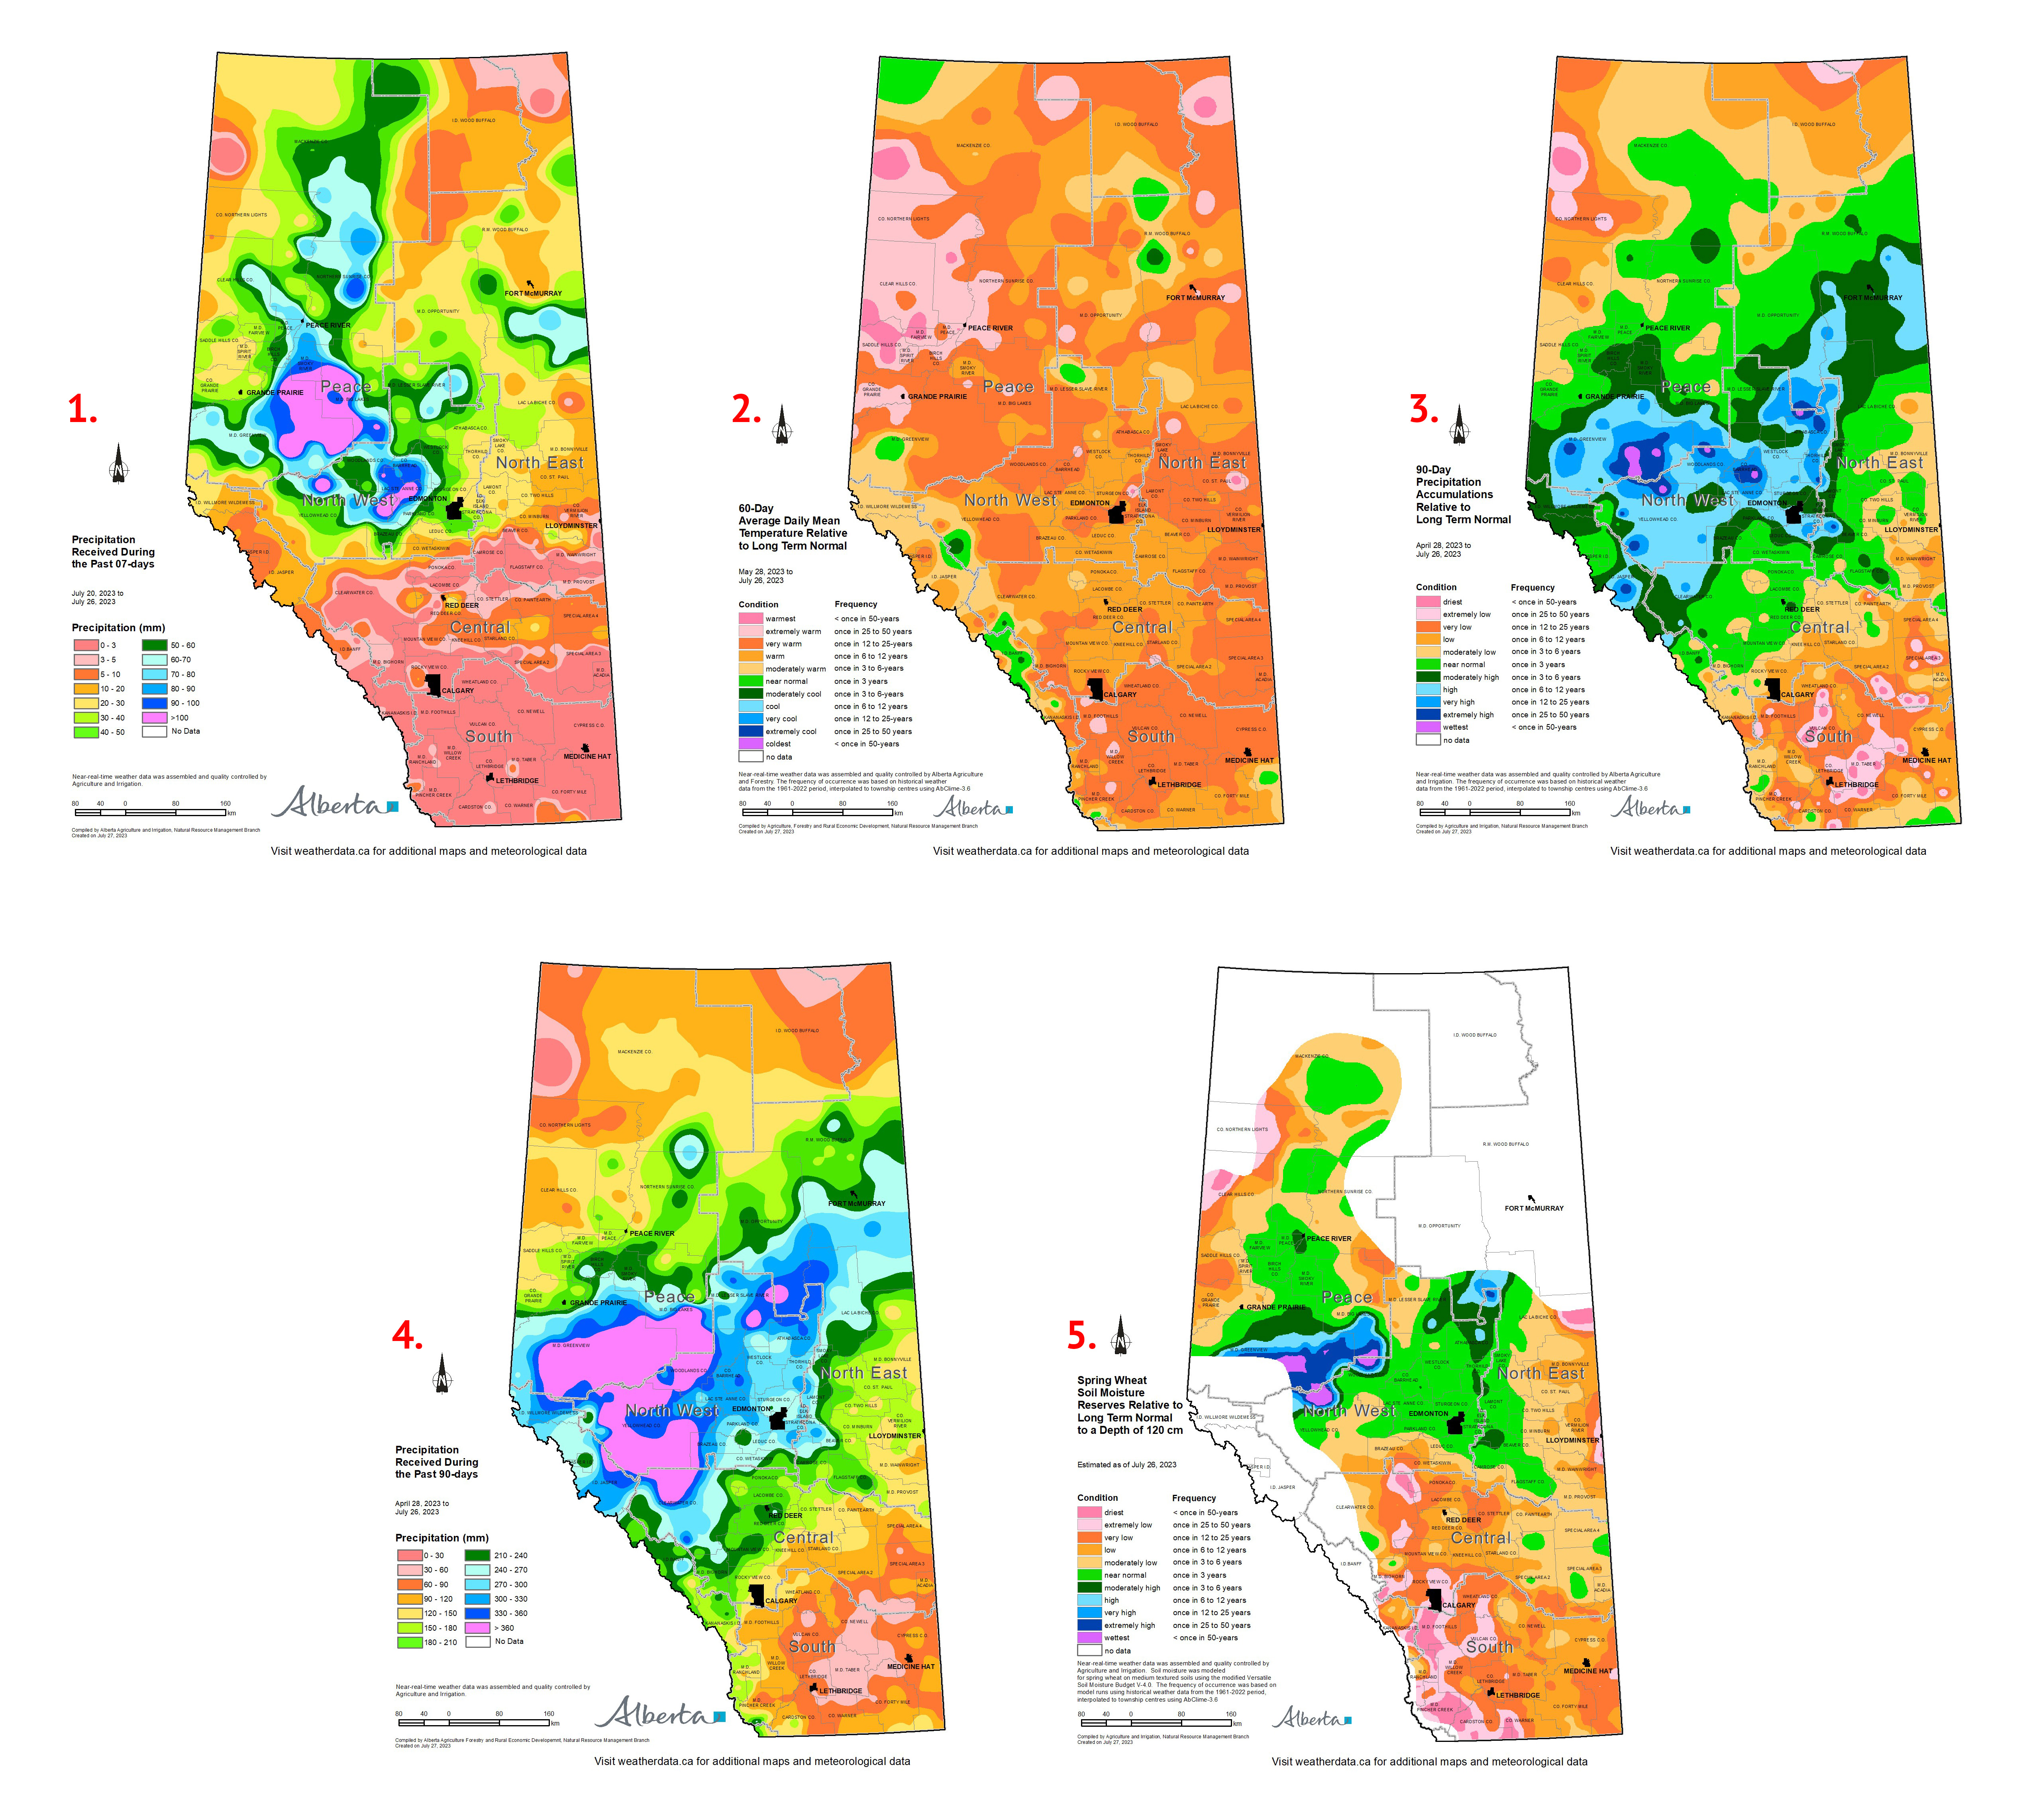
Map 1: Since the last report (June 19th), most areas north of the Yellowhead Highway have received at least 10 mm of rain, with many accounts of hail, associated with intense thunderstorm activity (map 1). Rainfall totals were greatest throughout much of the North West Region and most of the east-half of the Peace Region with many lands receiving more than 60 mm. The greatest amounts were recorded in the Forest Protection Areas with the Meekwap Auto station, located about 25 km northeast of Fox Creek, recording the most (162.3 mm). Across the Ag areas, the greatest amount (125.1 mm) was recorded in the Peace Region at the Valleyview AGDM station. In contrast about 50 km south of the Yellowhead Highway most lands remained dry down to the US border, with the exception of parts of the Central Region extending from near Red Deer and eastward towards Provost, were some lands received between 5 to 20 mm.
The driest areas of the Province, still remain in the Southern Region were many stations recorded no precipitation. Across the dry west-central portions of the Peace Region, 10 to 50mm was recorded and across the northern Peace Region rainfall totals ranged from roughly 25 to 75 mm. At this time of year 10 mm in one week is welcome, given the dry conditions, but is still not enough to meet crop water demands.
Temperature Patterns over the Past 60-days, as of July 26, 2023
Map 2: Crop moisture demands have been elevated due to above average temperatures that were persistent through June and July (Map 2). This follows an exceptionally warm May. Throughout the dry areas of the Peace Region many locales are estimated to be this warm less than once in 50 years, with a large area estimated to be this warm, fewer than once in 25-years, looking back as far as 1961. Similarly across the Southern Region, where it’s normally hot this time of year, temperatures have been this high, on average less than once in 12-25 years.
For those areas that received adequate moisture, warm temperatures are speeding crop development resulting in a lower frost risk as harvest time approaches. Conversely for those areas lacking moisture, warmer than average temperatures have exacerbated crop moisture stress.
Precipitation Patterns over the Past 90-days, as of July 26, 2023
Maps 3 & 4: Over the past 90-days, most of the North West Region has benefited from above average rainfall and some areas may have had too much moisture, with several widely scatted pockets of once in 50-year wet spells appearing (Map 3). There are currently four stations in the Forest Protection Area that have recorded more than 500 mm in this time frame, which is nearly double the 1961-2022 average. Areas around Whitecourt, closer to the Ag lands, have received in excess of 350 mm. Much of the North East and the northwestern portions of the Central Region has received near normal rainfall. This leaves a large part of the west-half of the Peace Region with below normal rainfall and large parts of the Southern Region with 90-day rainfall deficits exceeding once in 12 year lows, with several pockets near once in 50-year lows.
The lowest recorded precipitation amounts (Map 4) were at Wardlow (48.4 mm), Queenstown (49.7mm) and Lethbridge (50.3mm) which is roughly 1/3 of average over this 12 week period. This is in addition to chronically low soil moisture reserves that have provided little if any benefit to crops struggling against persistent heat and lack of rainfall. For perspective, a crop will thrive on 25 mm of rain per week when soil moisture reserves are adequate, once it’s actively established and it may need even more when it’s hot. During a single day, plant water use can exceed 10 mm per day on a well-watered field when temperatures exceed 30C and winds are moderate. Daily water requirements are satisfied by stored soil moisture reserves which are derived from recent precipitation and longer term unutilized moisture supplies. When plant water demand greatly exceeds water availability for long periods of time, yield potential declines. At some point plants may simply wilt and stop growing and in extreme cases they will expire.
Soil Moisture Reserves, as of July 26, 2023
Map 5: Soil moisture reserves have rebounded significantly across parts of the Peace and Northwest Regions, with parts of the North West approaching once in 50-year highs (Map 5). This represents excess moisture and these areas are now at greater risk for flooding should further excess rains fall. In contrast soil moisture reserves remain well below normal across much of the North East Region and across the west-half of the Peace Region as well as through most of the Central Region and all of the Southern Region. Continued rainfall is needed immediately in these areas to support those crops that still have profitable yield potential.
Perspective
By the end of July, most seeded crops have physiologically “set” their maximum yield potential given the moisture they received so far in the season. The weather conditions through the rest of August will either sustain that yield potential or potentially degrade it. On the other hand pastures that are struggling for moisture will still benefit from rainfall well into the fall and improve yield potential, ahead of the next scheduled cut, even if that’s not until the following year.
With crop moisture demand still high in most areas, soil moisture reserves typically do not start building until the seeded crops ripen and their need for moisture wanes. This fall most areas will benefit from above average precipitation which will be needed to build up deplete reserves ahead of next growing season.
Contact Us
Saddle Hills
Junction of Hwy 49 & Secondary Hwy 725
RR1, Spirit River AB
T0H 3G0
T. 780-864-3760
Fax 780-864-3904
Toll-free 1-888-864-3760
frontdesk@saddlehills.ab.ca
Sign up to our Newsletter
Stay up to date on the Saddle Hills activities, events, programs and operations by subscribing to our eNewsletters.