Moisture Update - October 1, 2025

Precipitation
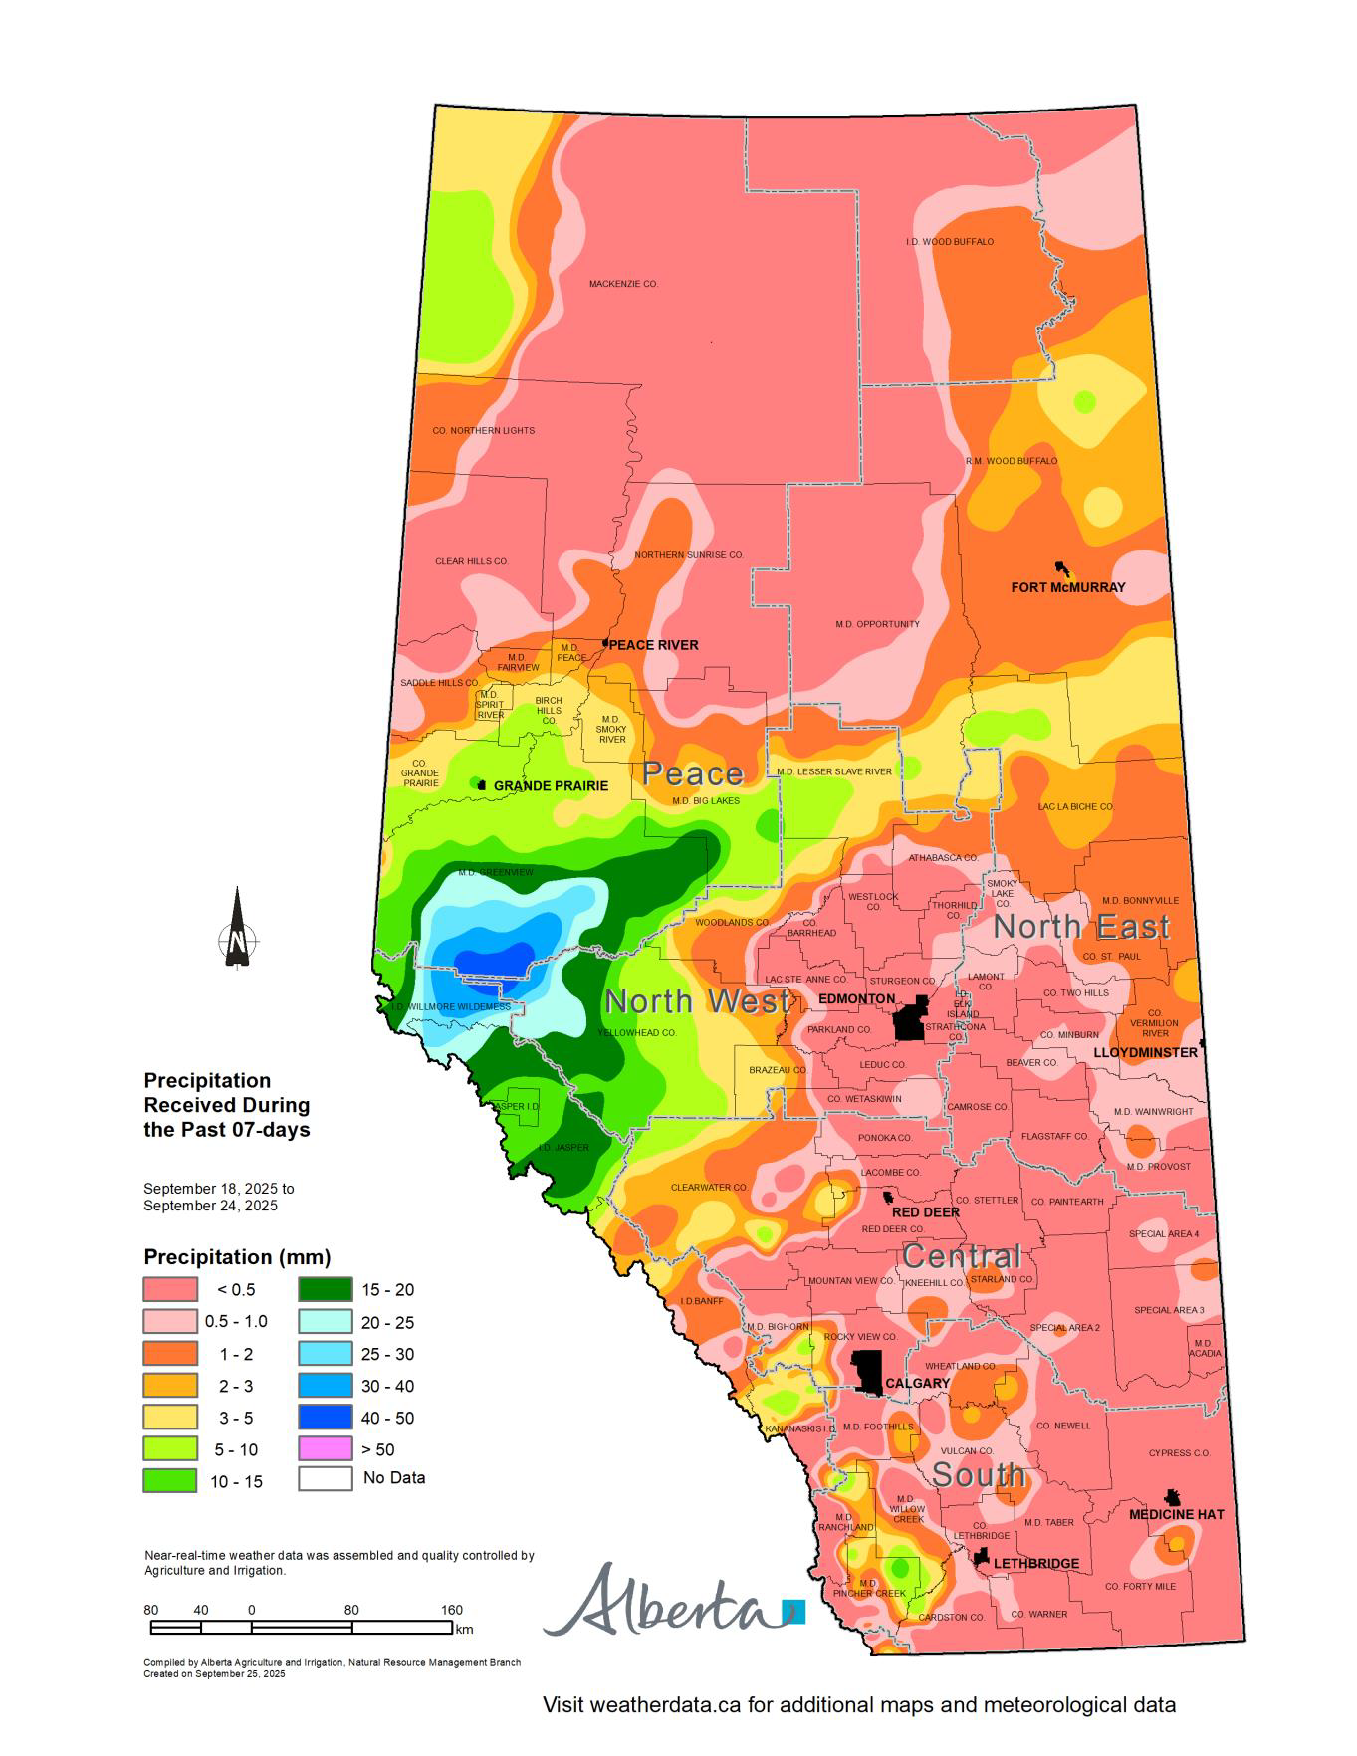
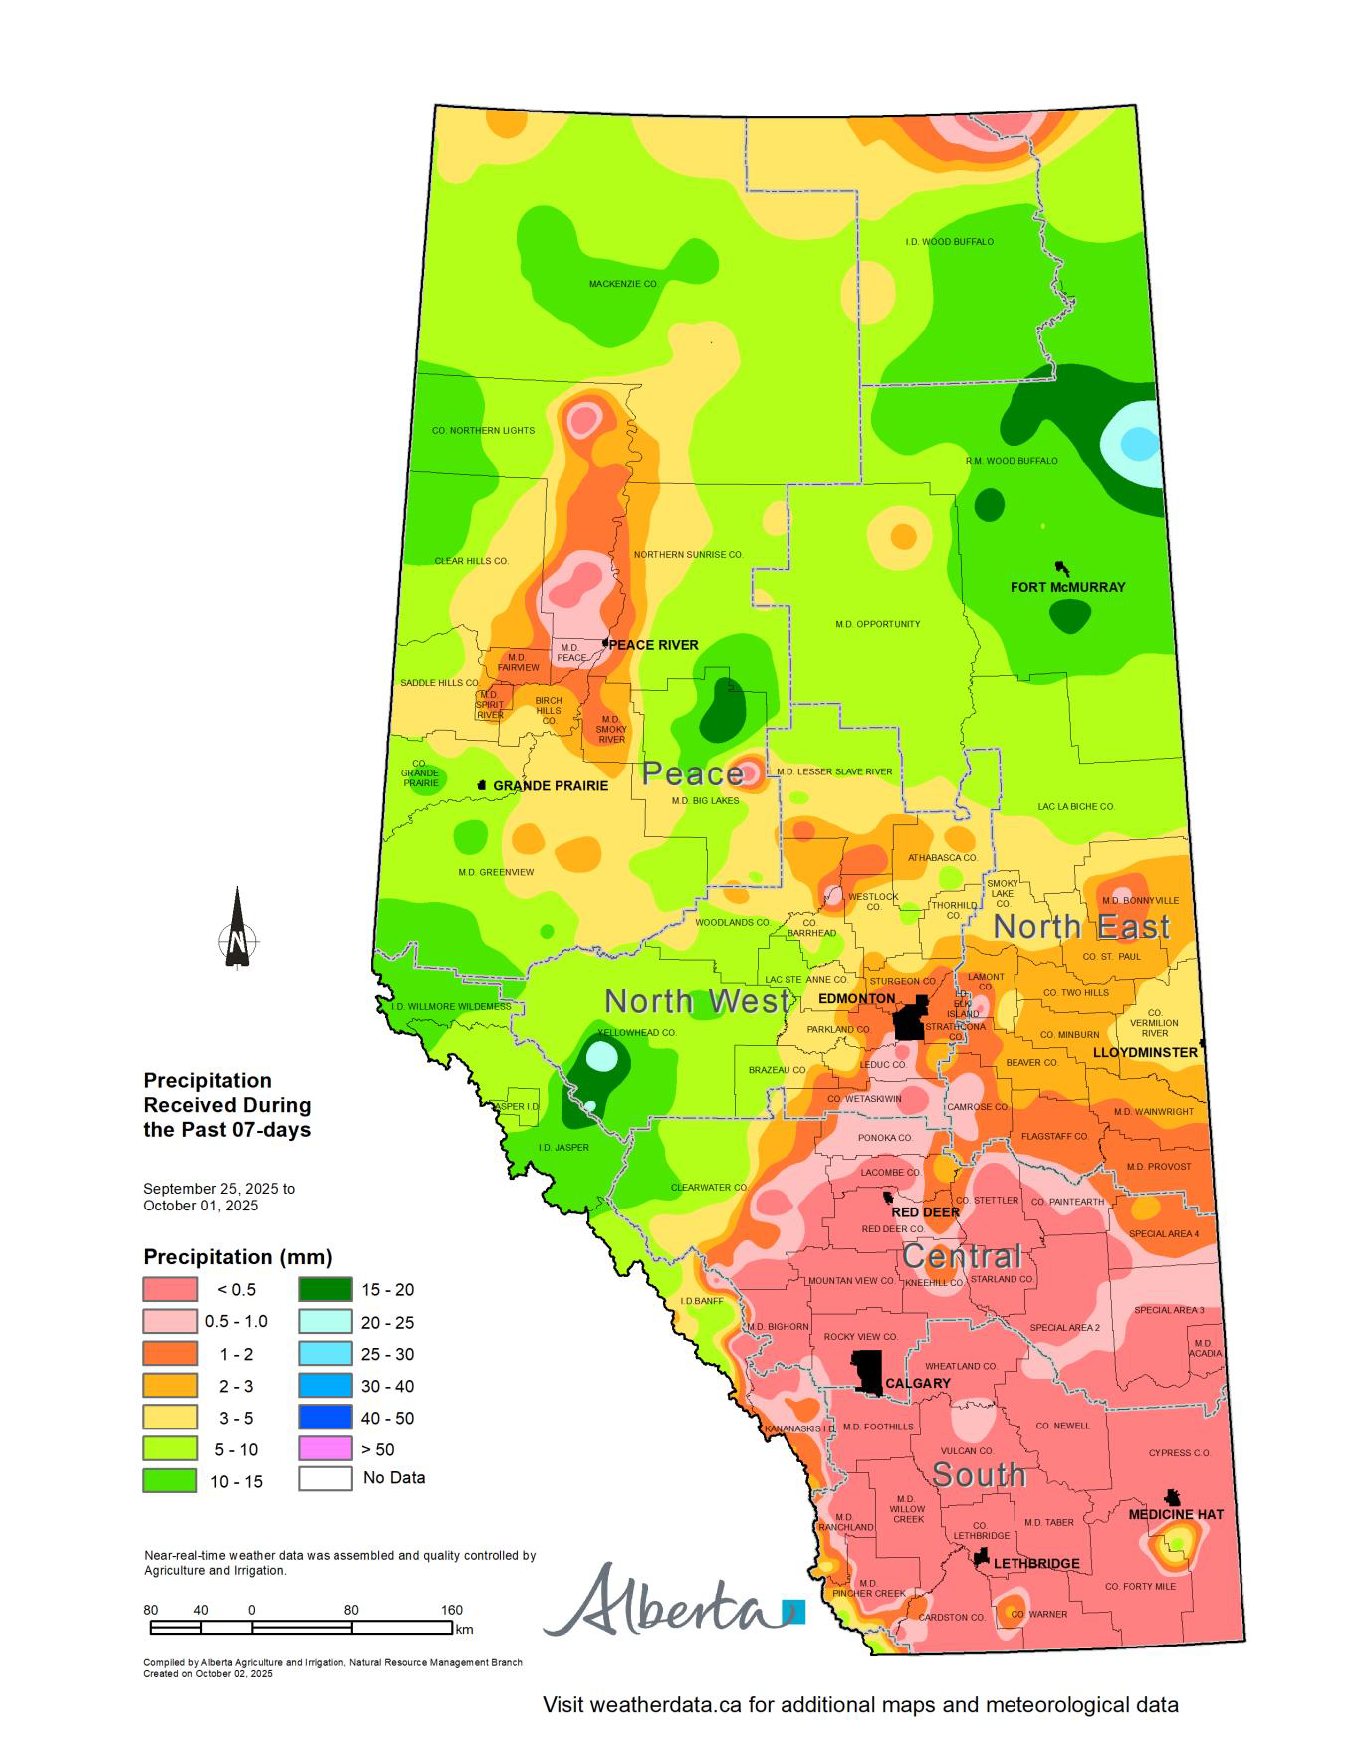
Maps 1, 2 & 3: Over the past two weeks, most of Alberta’s agricultural regions received very little precipitation (Maps 1 and 2). While scattered showers brought between 3 and 10 mm of precipitation to isolated areas, overall rainfall remained well below the long-term accumulation for this time of the year (Map 3).
In the South and Central Regions, light showers delivered between 2 and 10 mm of rain to parts of Clearwater, Pincher Creek, Ranchlands, and Cypress counties (Maps 1 and 2).
Across the North East and eastern half of the North West Regions, precipitation was close to seasonal norms, with most areas receiving less than 10 mm, primarily during the past 7 days (Maps 1, 2, and 3).
The Peace Region and the west side of the North West Region saw the highest rainfall totals over the past two weeks (Maps 1 and 2). Some areas within in the counties of Grande Prairie, Greenview, Big Lakes, Mackenzie, Brazeau, Yellowhead, and Woodlands received between 10 to 25 mm of precipitation, an amount more typical for this time of the year (Map 3). However, areas stretching from the Saddle Hills County to Smoky River, and northward to Northern Lights County, received less than 10 mm, which is well below the long-term average of 20 to 20 mm (Maps 1, 2, and 3)

Temperature
Map 4: Over the past two weeks, average daily mean temperatures across Alberta varied. Conditions ranged from moderately warm in the southern Peace and western North West Regions, to extremely warm and warmest (once in more than 50 years) across the eastern half of the province.
These high temperatures extended from Pincher Creek northward to Wood Buffalo, and east to the Saskatchewan border. The warmer weather has helped to hasten crop harvest and increase soil moisture evaporation.
Growing Season Trends
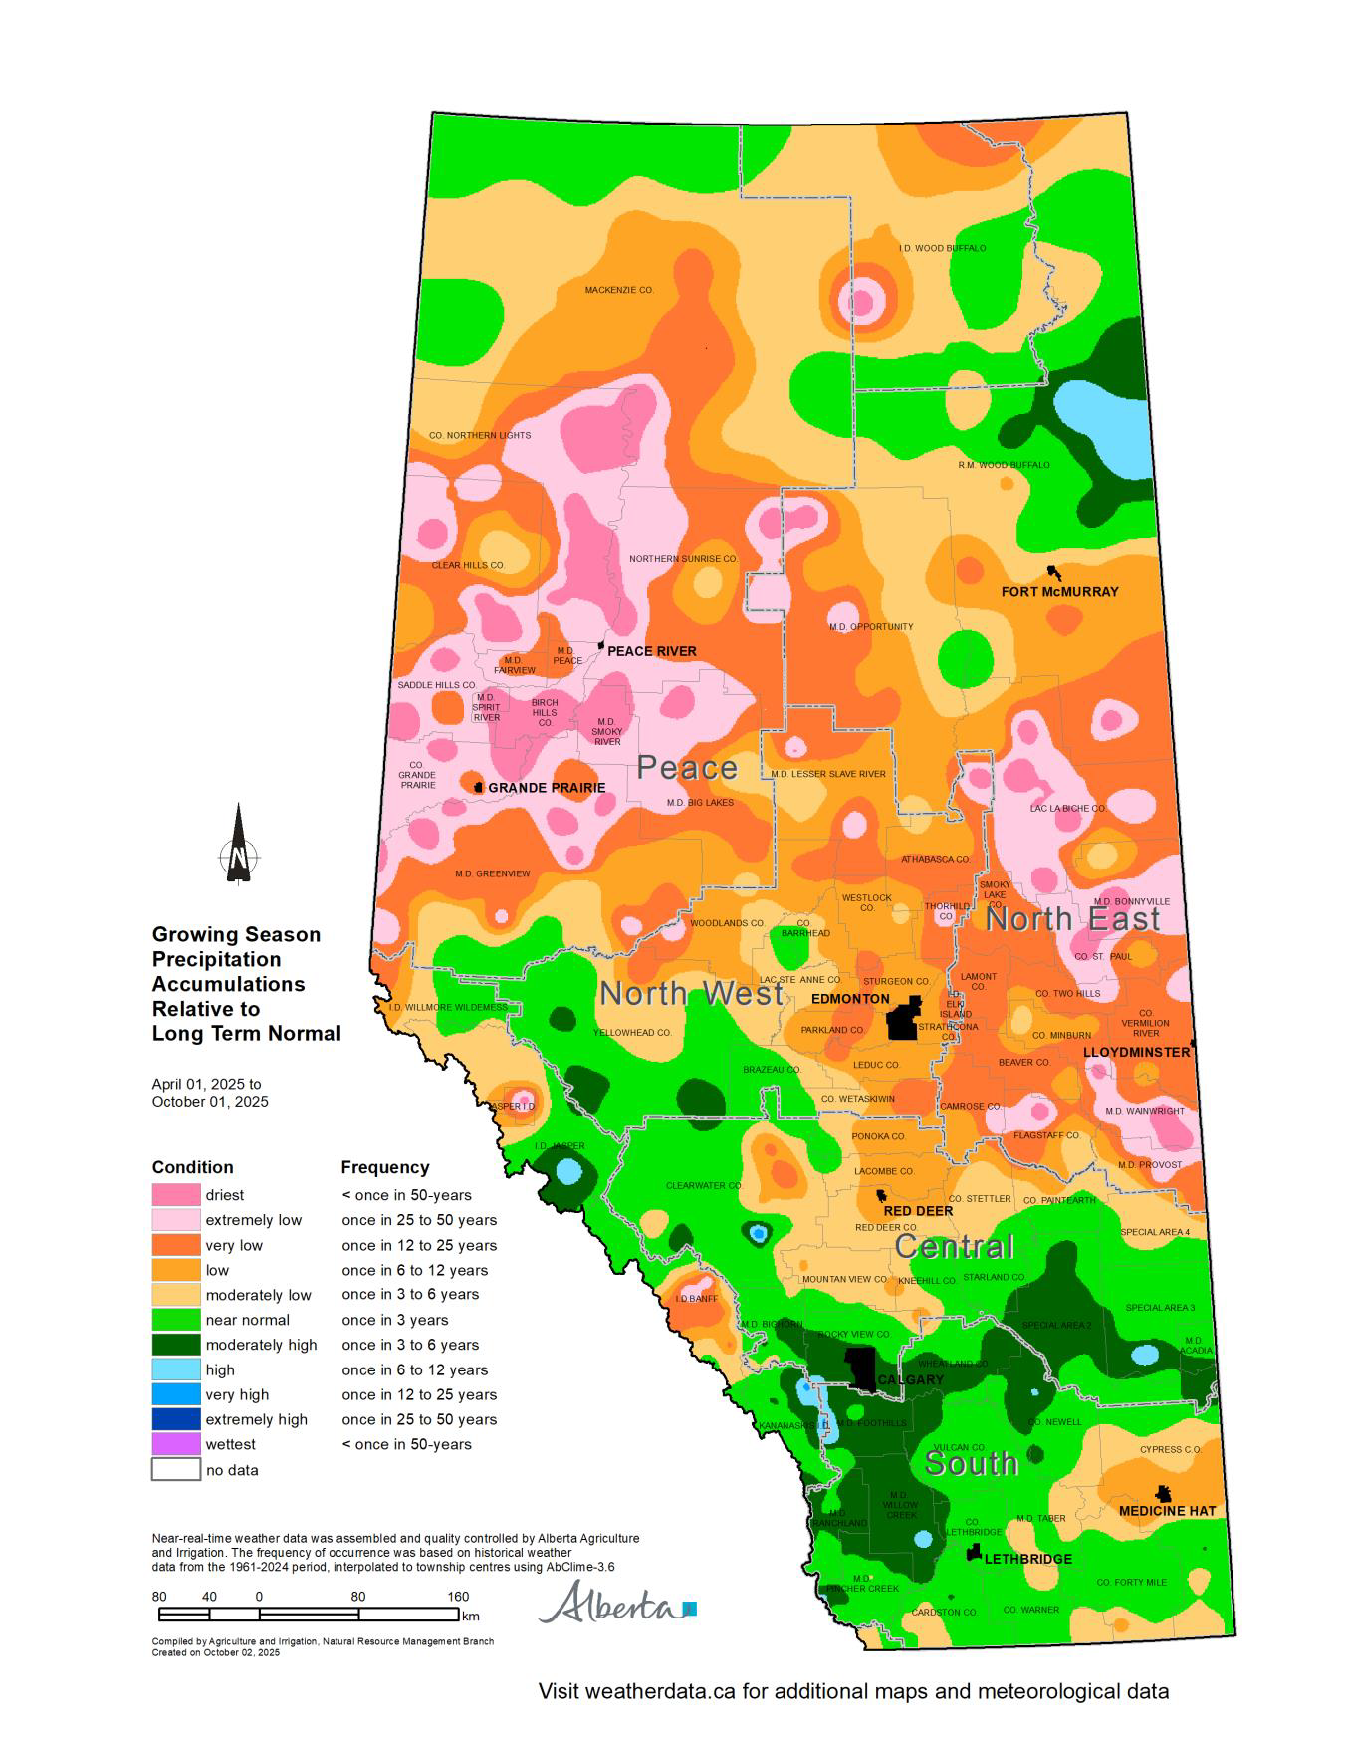
Maps 5 & 6: Limited rainfall over the past two weeks has reduced growing season precipitation accumulations across Alberta’s Agricultural Regions, relative to the long-term normal (Map 5). While much of the South, and parts of the Central and North West Regions, remain near normal, areas that previously showed moderately high growing season precipitation have seen a noticeable decline, with some nearly losing their above-average status.
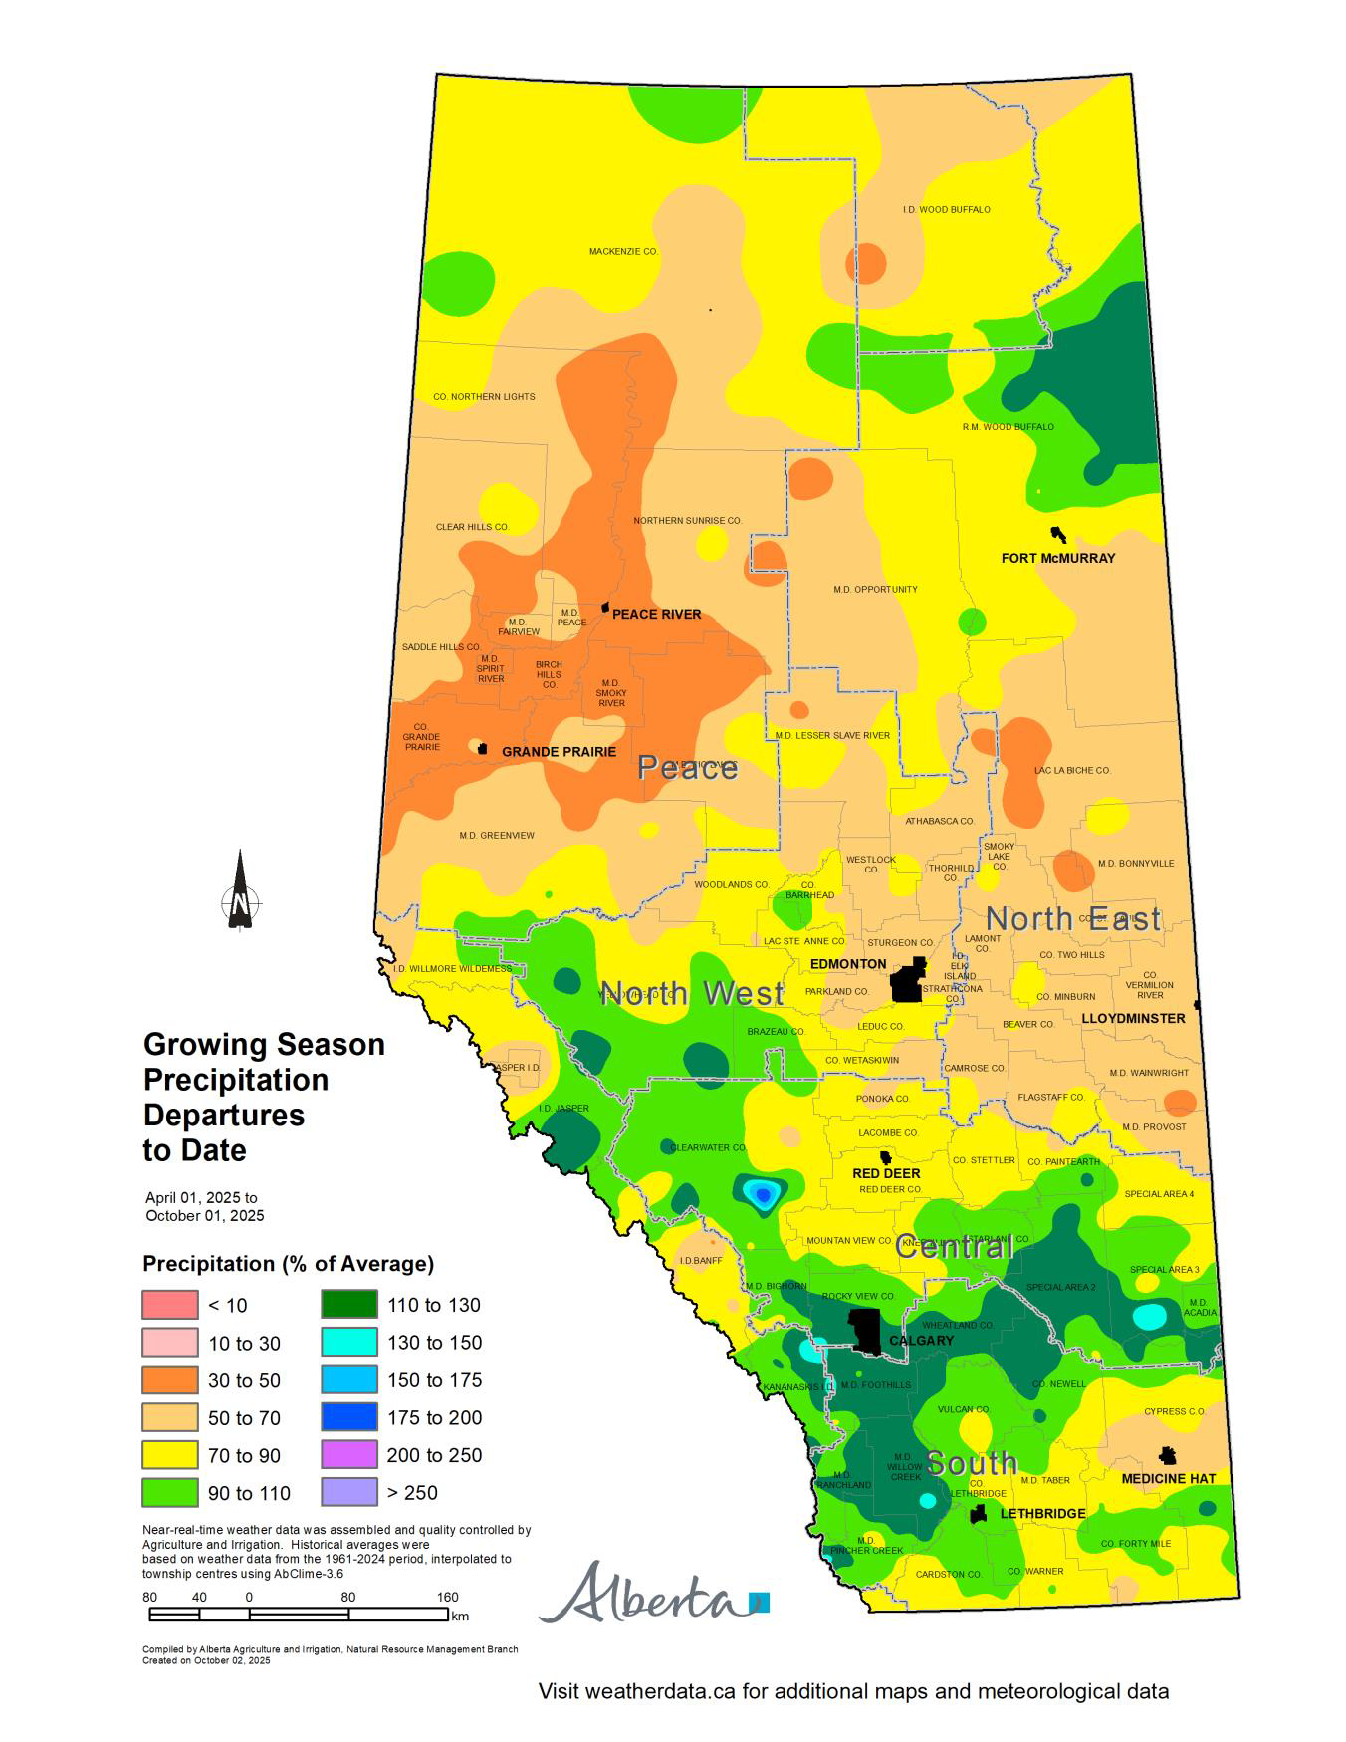
In the South Region, the extent of the moderately low to low growing season precipitation has increased, particularly in Forty Mile, Cypress, Newell, Warner, and Taber Counties (Map 5). Most of the region has received 70% to 90% of the long-term average, with large portions of Cypress County receiving 50% to 70% (Map 6).
In northern Alberta, growing season precipitation remains moderately to extremely low (Map 5). The boundary between near-normal and moderately low precipitation has remained largely unchanged since the previous report and stretches through Special Area No. 4, into the Counties of Paintearth, Stettler, Red Deer, Kneehill, and Mountain View, and continues north through Clearwater into Wetaskiwin, and Brazeau, and westward into Yellowhead County and the M.D. of Greenview. Most of these areas have received only 50% to 90% of their long-term average (Map 6).
Across the North East and Peace Regions, growing season precipitation continues to fall short of long-term normal (Map 5). Many areas now report very low to extremely low levels, with most receiving 50% to 70% of the long-term average (Map 6). Zones with precipitation departures of 30% to 50% of normal have expanded within Lac La Biche, Grande Prairie, Spirit River, Birch Hills, Smoky River, Big Lakes, Greenview, Saddle Hills, Clear Hills, Fairview, Peace, Northern Sunrise, Northern Lights, and Mackenzie.
Soil Moisture Reserves
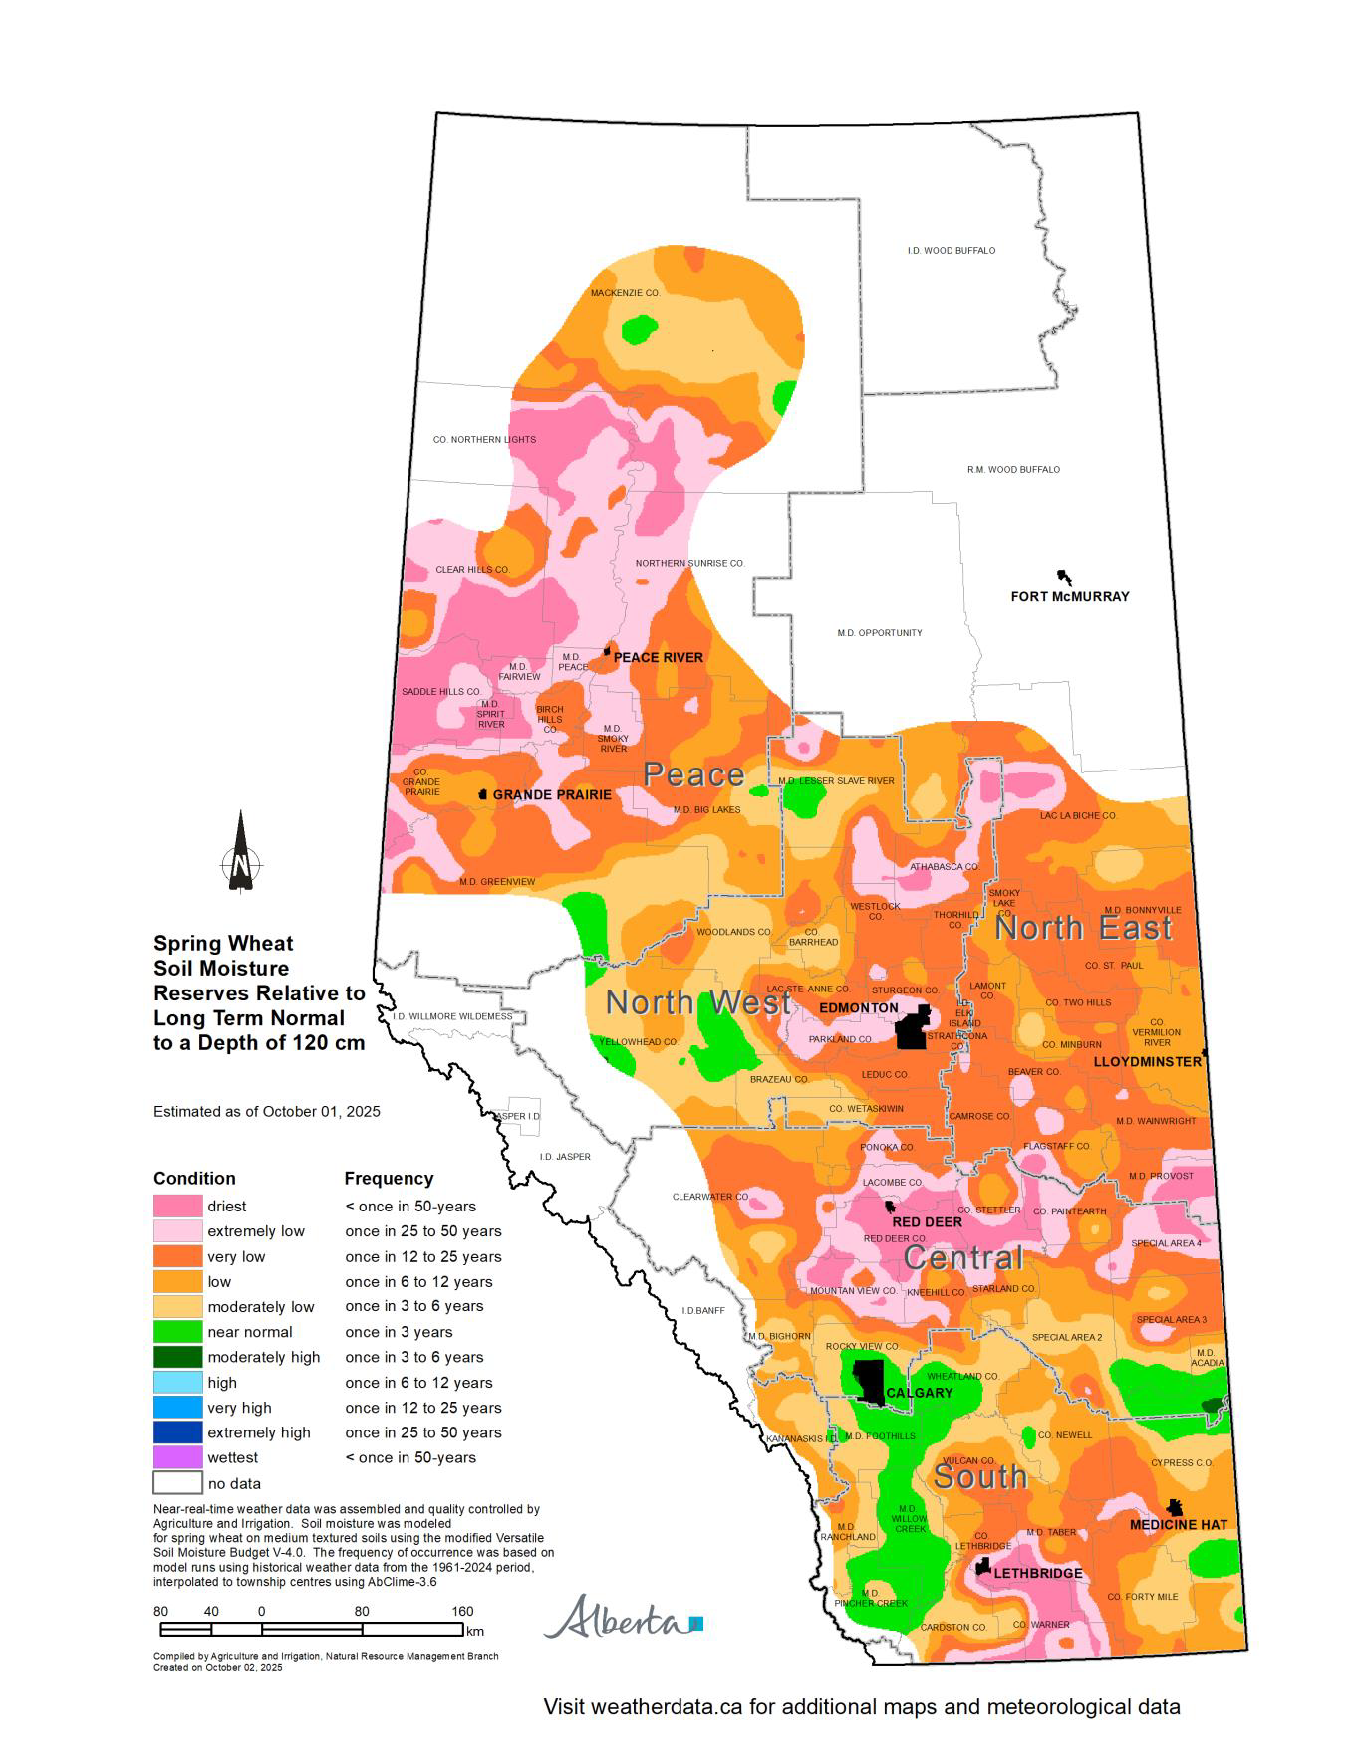
Maps 7, 8 & 9: Lower precipitation over the past two weeks has continued to reduce soil moisture reserves across much of Alberta’s Agricultural Regions, relative to long-term normal (Map 7).
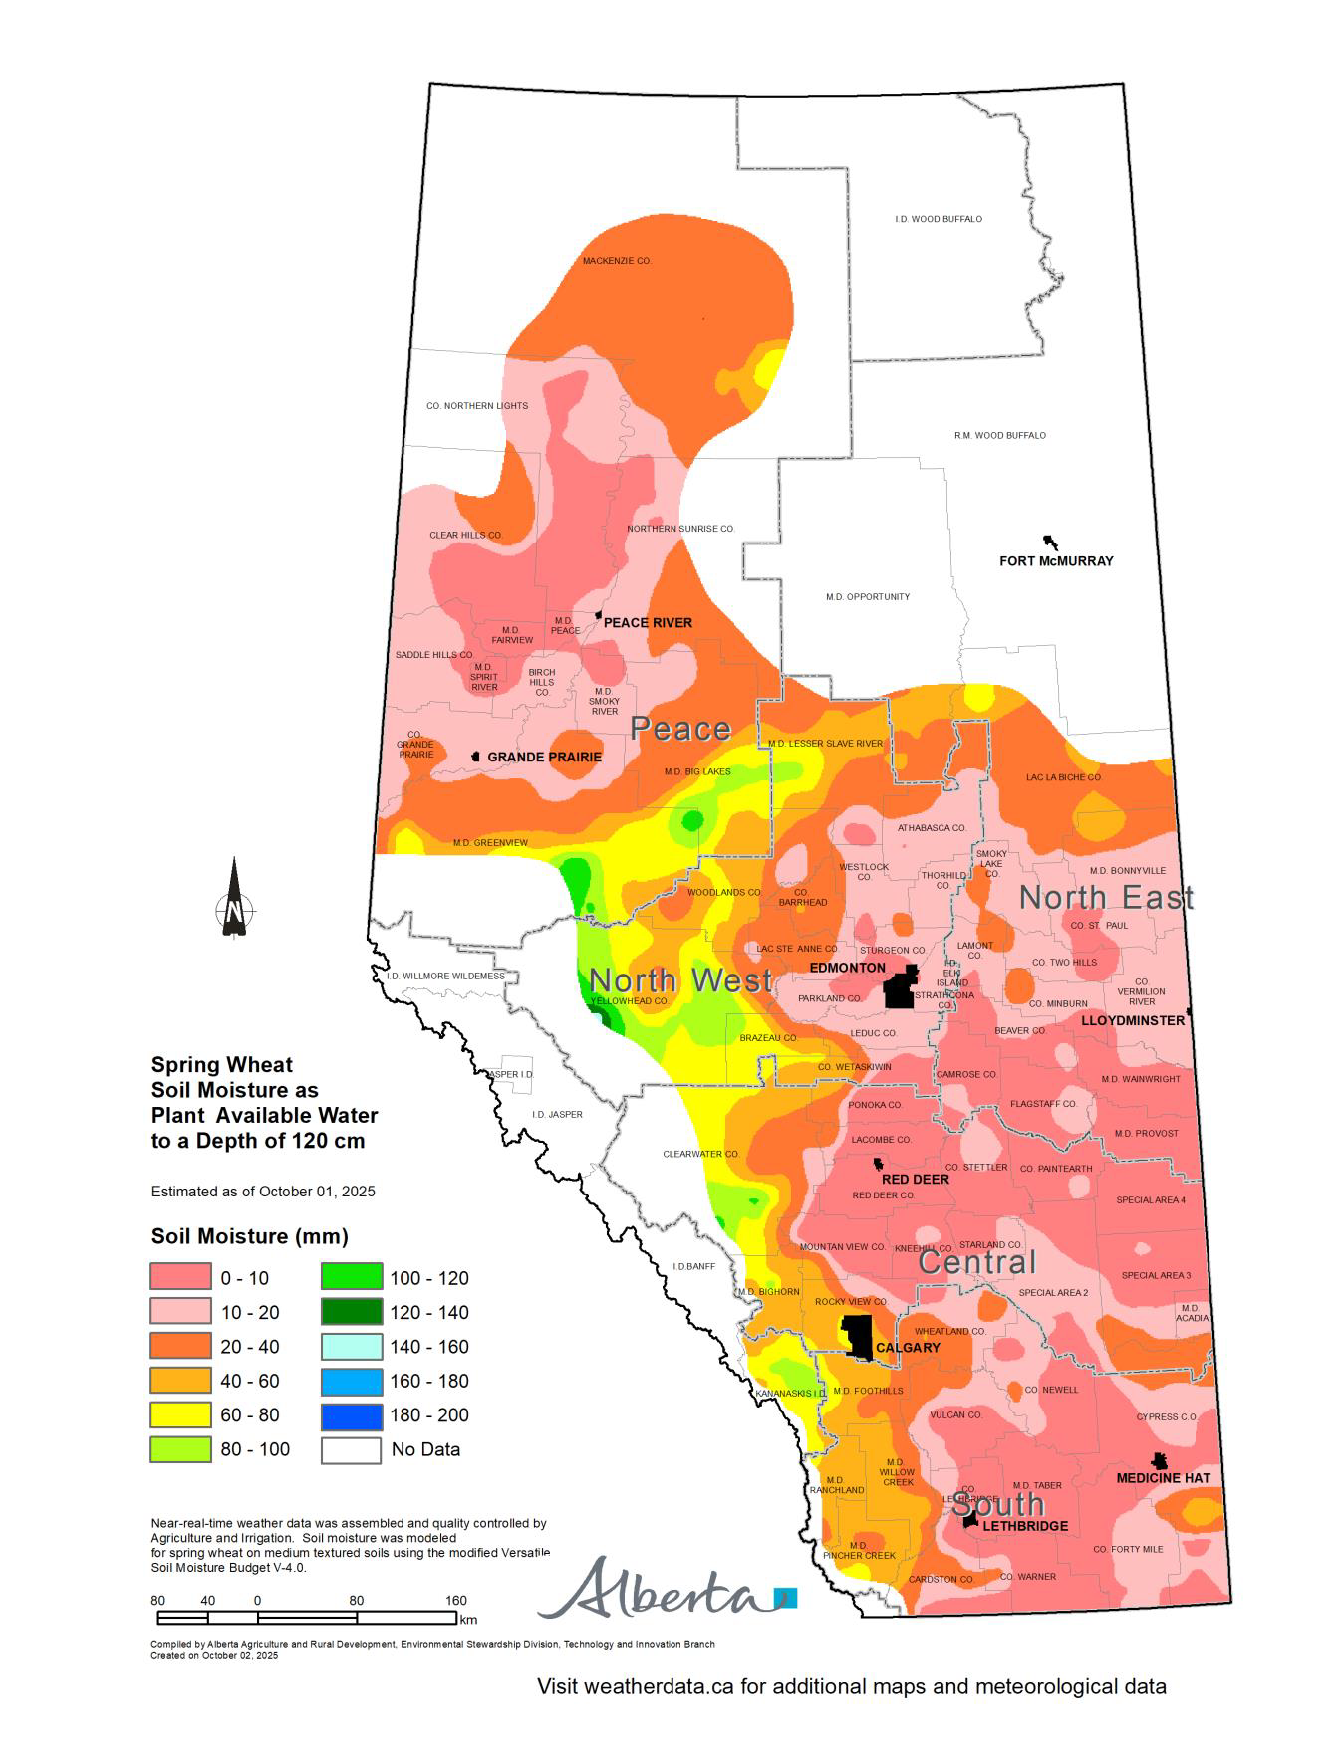
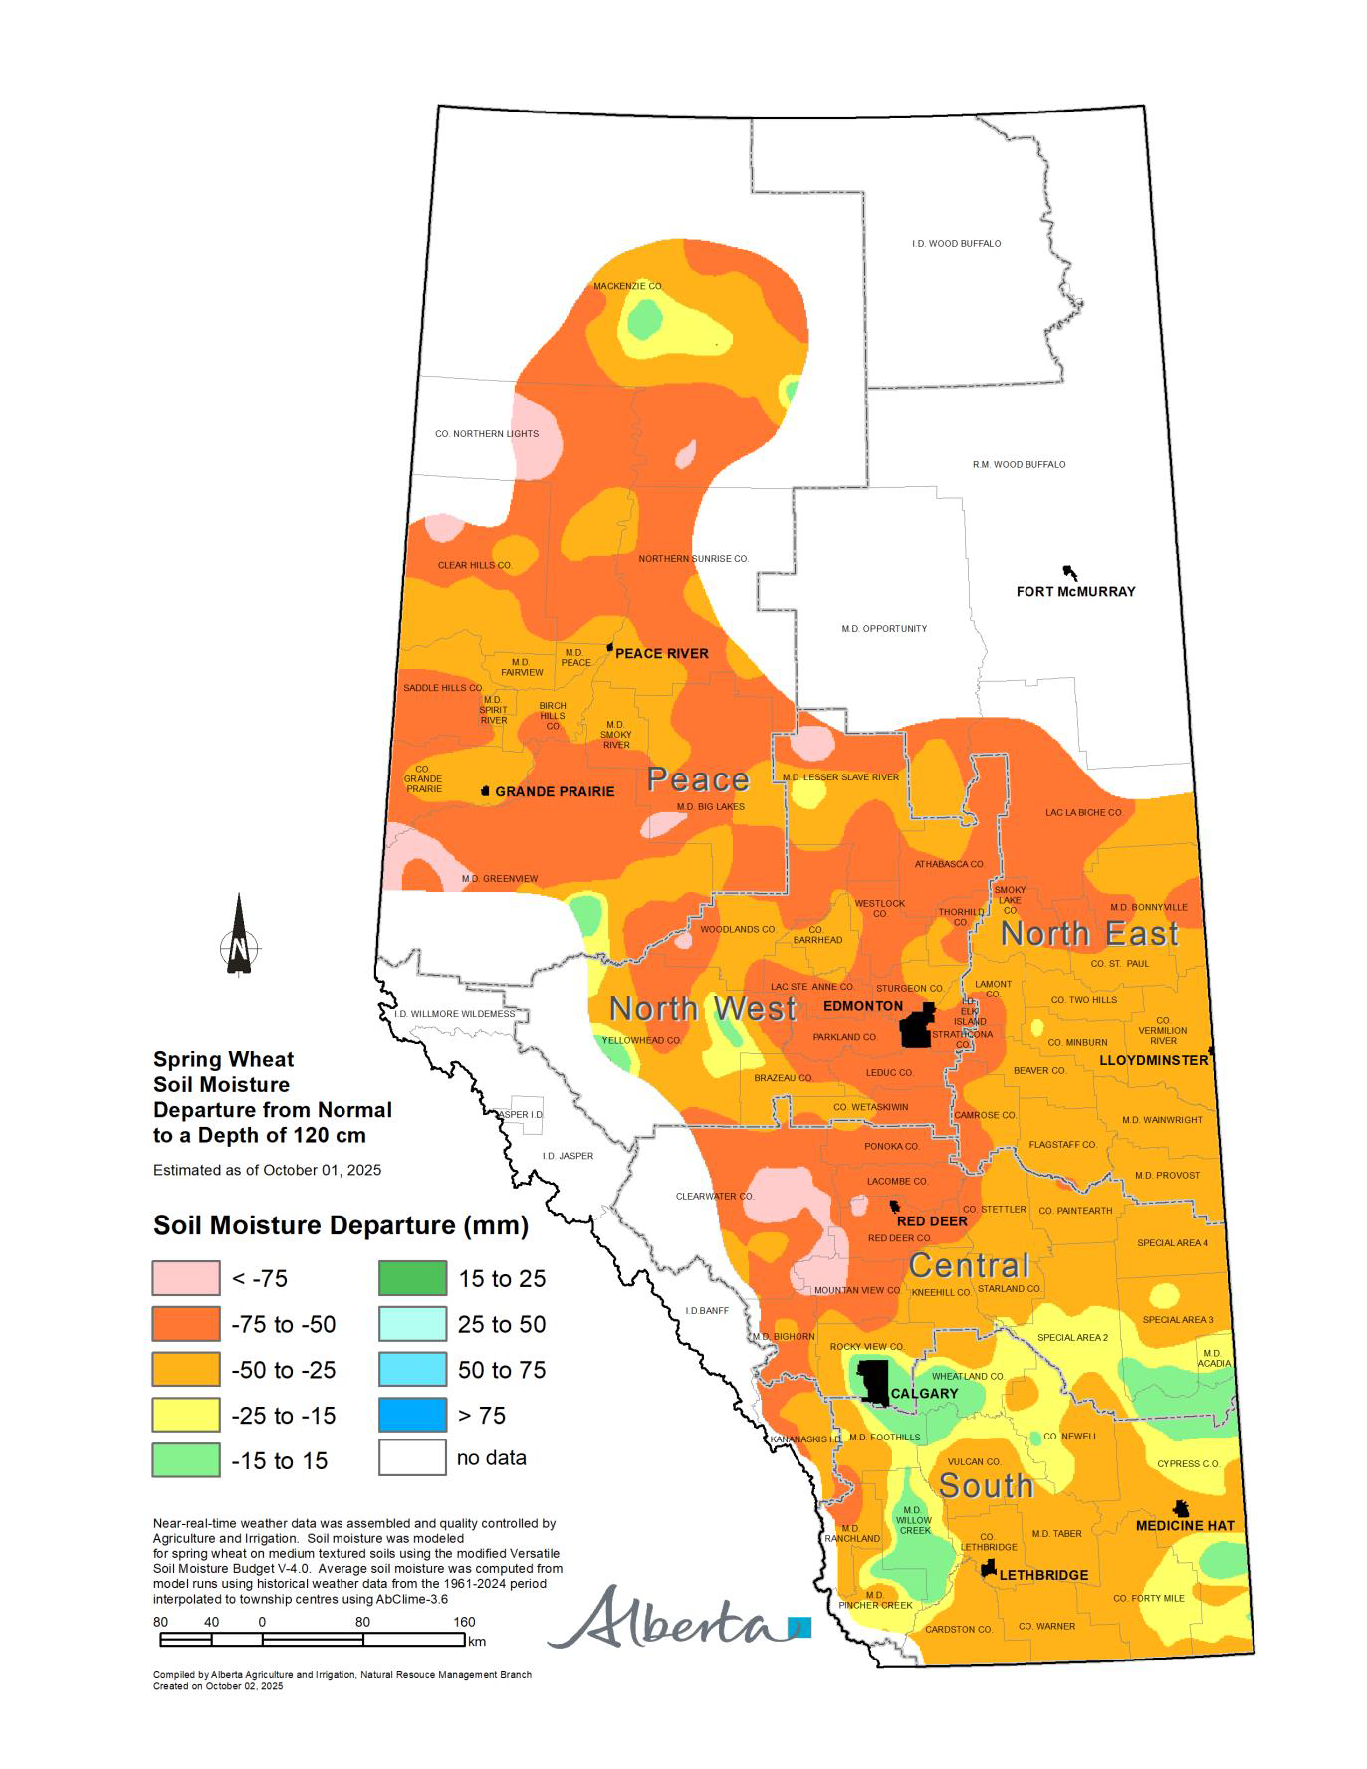
Near-normal soil moisture reserves are now confined to select areas, including parts of Yellowhead, Greenview, Lesser Slave River, Rocky View, Foothills, Wheatland, Willow Creek, Pincher Creek, Vulcan, Special Areas No. 2 and No. 3, Acadia Valley, and Cypress Counties (Map 7). In these zones, plant-available water is estimated to range from 20 to 60 mm (Map 8), with moisture departures of -15 to 15 mm compared to normal (Map 9).
Across the remainder of the province, estimated soil reserves are now rated as moderately low to driest, once in more than 50-year lows, relative to long-term normal (Map 7). The extent of the very low to driest conditions has expanded across the Central, North West, North East, and Peace Regions, indicating a deterioration from the previous report.
In these severely affected areas, plant-available water is estimated to be less than 20 mm (Map 8), with moisture deficits ranging from 25 to 75 mm below normal (Map 9).

Contact Us
Saddle Hills
Junction of Hwy 49 & Secondary Hwy 725
RR1, Spirit River AB
T0H 3G0
T. 780-864-3760
Fax 780-864-3904
Toll-free 1-888-864-3760
frontdesk@saddlehills.ab.ca
Sign up to our Newsletter
Stay up to date on the Saddle Hills activities, events, programs and operations by subscribing to our eNewsletters.