Moisture Updates - March 2, 2023
Synopsis
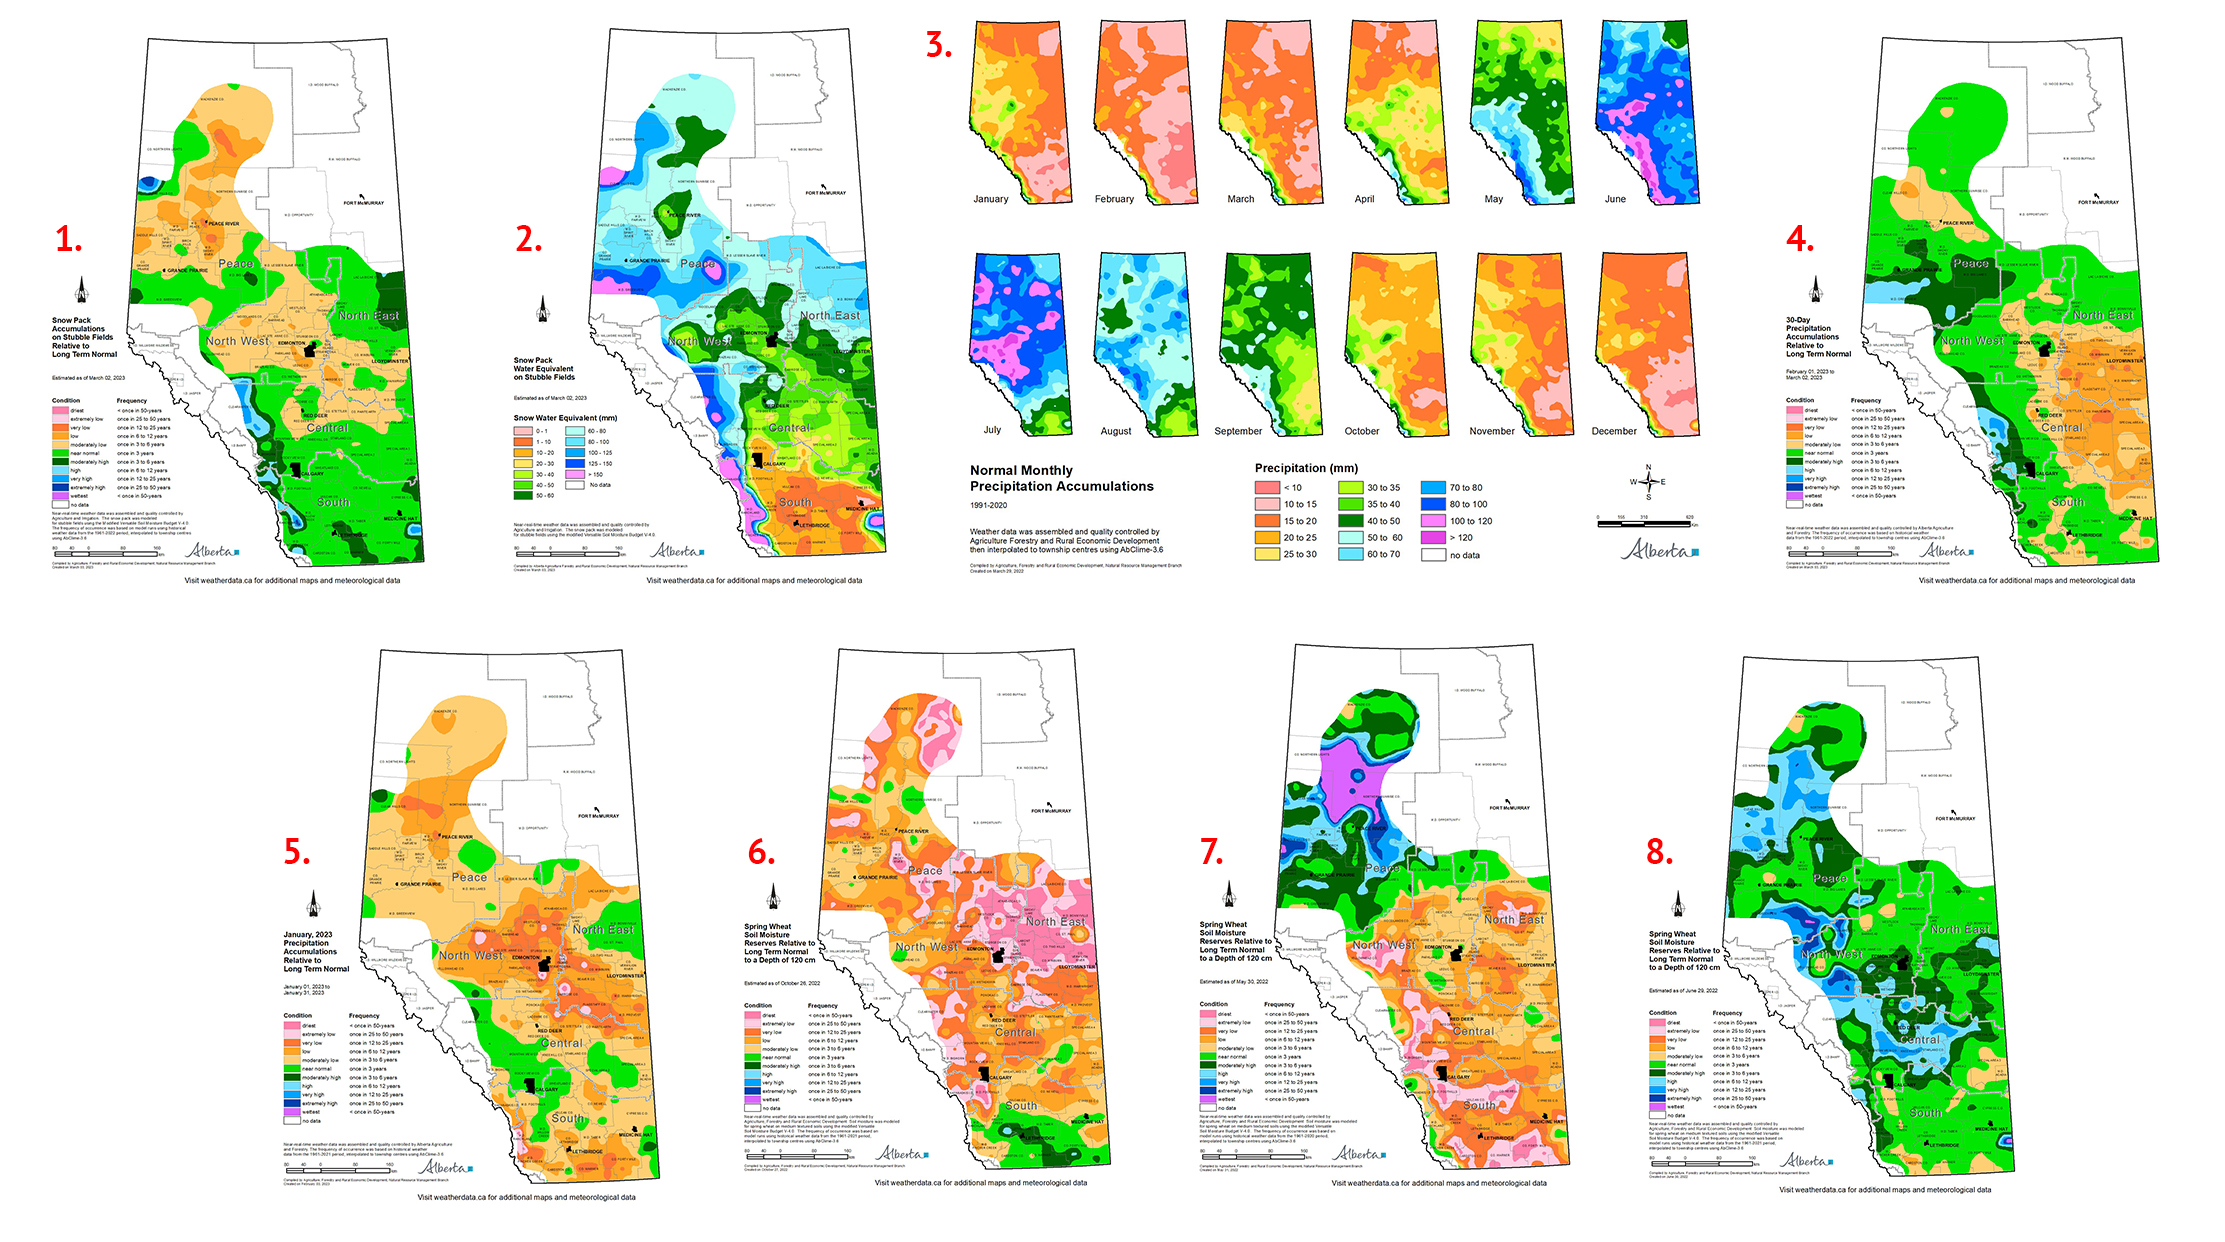
Maps 1 & 2: Currently snow packs across the province are generally estimated to be near normal (based on the 1961-2022 period) for most areas of the province south of Red Deer and broadly trending to once in 3 to 6 year lows across the southern half of the North East Region and throughout much of North West Region (map 1). Across the Peace Region, snow packs are currently near one in 6 to 12 year lows throughout many areas. However, winter is not done with us yet! Most long range forecasts are calling for a slow start to spring as the Arctic Vortex lingers and persistent La Nina conditions potentially grade into an El Nino. Spring seasonal weather patterns are usually unpredictable and often encourage active weather as lingering polar winter air clashes with warmer moist spring air. Couple this with the transition from La Nina to El Nino and this may be amplified. As a result, there is still time for snow packs to continue to develop. This may bode well for the drier parts of the province were snow packs are currently below normal.
Snow Water Equivalent
Map 3: Currently water contained in the snow pack, a.k.a. snow water equivalent (SWE), is highly variable across the province, ranging from less than 10 mm across most of the south, which is near normal for this time of year, to upwards of 80 to 90 mm across the northern portions of the North East Region and 60 to 80 mm across many parts of the Peace Region (map 2). Drier areas in the Central, North West and North East Regions have less than 50 mm of water locked into the snowpack. For perspective, historically winter (November 1 to March 31) accounts for less than 20% of the average annual precipitation received across the southern parts of the province, upto about 35% through parts of the Peace Region. Map 3 serves as a convenient reminder that February and March are typically amongst the driest months of the year and it’s not until April and May that we start to see a shift from the drier winter period, to the wetter late spring and early summer months.
Recent Precipitation Patterns
Maps 4 & 5: While February is typically the driest month of the year, most of the west-half and southern portions of the province have been receiving near normal moisture over the past 30-days (map 4), Precipitation patterns across much of the east-half of the province still remain below normal, but overall precipitation patterns have improved relative to the drier than normal conditions experienced through the month of January (map 5).
Perspective
Maps 6, 7 & 8: Last year, significant moisture deficits developed across many areas throughout the late summer and early fall (map 6), following a drying trend that emerged in late July and early August and persisted well into October, culminating in significant soil moisture deficits at freeze up. Notably some of the driest areas this fall, (North East Region and many lands bordering the foothills) are currently under near normal to above normal snowpacks (map 1).
It’s still far too early to tell how winter snowpacks will affect spring soil moisture reserves as Mother Nature can “turn on a dime”. We are very much in a wait and see scenario as producers begin preparations for yet another cropping season. For example, by the end of May in 2022 many were facing severe moisture deficits (map 7) following the drought of 2021. Then as June rolled around, generous rains broke the dry spell and soil moisture recovered (map 8) and most crops did relatively well.
Sign up to our Newsletter
Stay up to date on the Saddle Hills activities, events, programs and operations by subscribing to our eNewsletters.